Method not found System.Array.Empty

.NET 4.6 introduced a new method, System.Array.Empty which introduces a cache for empty arrays. However this change can cause a problem which commonly shows up in MVC projects during the initialisation of bundles.


[MissingMethodException: Method not found: '!!0[] System.Array.Empty()'.]
MvcApp.BundleConfig.RegisterBundles(BundleCollection bundles) +0
MvcApp.MvcApplication.Application_Start() +384

Strangely enough, this error can often happen even when the project targets 4.5.2 or lower; where this method is not expected to exist! Looking at the IL shows that the build is indeed calling Array.Empty.


IL_0000: ldarg.0
IL_0001: ldstr "~/bundles/jquery"
IL_0006: newobj instance void [System.Web.Optimization]System.Web.Optimization.ScriptBundle::.ctor(string)
IL_000b: ldstr "~/Scripts/jquery-{version}.js"
IL_0010: call !!0[] [mscorlib]System.Array::Empty()
IL_0015: callvirt instance class [System.Web.Optimization]System.Web.Optimization.Bundle [System.Web.Optimization]System.Web.Optimization.Bundle::Include(string, class [System.Web.Optimization]System.Web.Optimization.IItemTransform[])
IL_001a: callvirt instance void [System.Web.Optimization]System.Web.Optimization.BundleCollection::Add(class [System.Web.Optimization]System.Web.Optimization.Bundle)
IL_001f: ldarg.0

So what’s going on here? The problem is that the code is building on a machine without the correct reference assemblies installed. The compiler is linking to the 4.6 reference assemblies instead of; for example, the 4.5.2 assemblies – you’ll find a warning in your build to indicate this. Finding the Array.Empty method; the compiler optimises the call to use this method. At runtime, running against the 4.5.2 assemblies, the method is no longer available and the call fails.

The fix is simple – make sure you’ve got the reference assemblies installed for your target. For example, for 4.5.2 you need to install the 4.5.2 developer pack.

Raspberry Pi Electricity Monitor

Lowering energy consumption is a great way to save money; and you can’t improve something without measuring it. An internet connected energy monitor would be great, but spending money to save money leaves a bit of a sour taste. How about dragging out that Raspberry Pi from the back of the garage; and using that to do it?

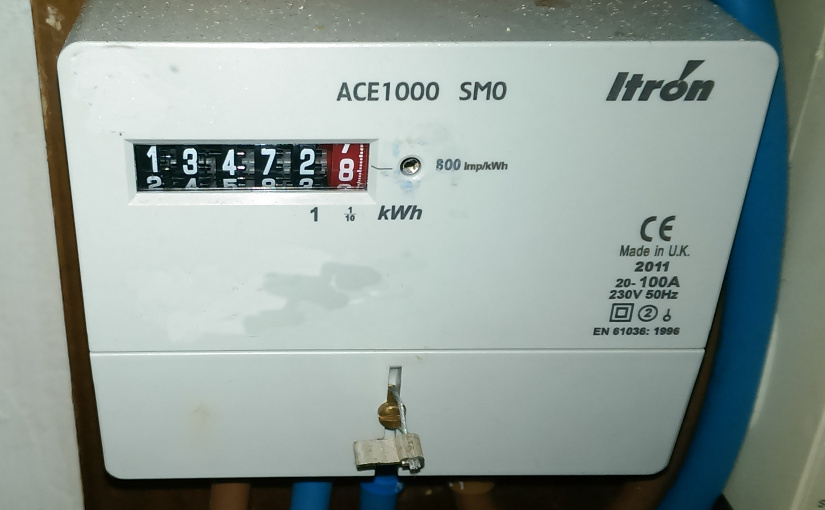
I think for some electricity meters you can wire up directly to the meter; but it’s a bit too close to 240V for my taste. Luckily many electricity meters also have a “pulse output”; a blinking light that indicates consumption – usually 1 pulse for a watt hour, (Wh) equivalent to using one watt for one hour; and 1000 pulses for a kilowatt hour, (kWh) which is about 10p worth of electricity at the moment. Perhaps my electricity meter is a bit unusual – an easy to find PDF online gives the “meter constant” as 800 pulses per kWh; so it’s best to check.

Once you know your meter constant, you can of course get various apps like this one to do it all for you; using the phone camera to watch for the flashing LED. However my wife refuses to hold the phone while i walk around the house turning all the light fittings on and off; and I couldn’t find a stand for my phone that would hold it in the right place. So i’m forced to do something more interesting.

Reading the LED using a Pi is pretty easy in principle. A “light dependent resistor” (LDR) is a component whose resistance decreases as it is exposed to more light. By measuring the resistance we can detect the change in light – we can tell when the LED is on or off. Getting these components and connecting them up to the Pi was probably the most difficult part for me – but the Adafruit website has a good guide, to summarise:

  • Get an LDR like this one; with a resistance range from 200KΩ to 10KΩ
  • Get a 1uF capacitor like this one, rated for greater than 5V
  • Use a Pi pin diagram to make sure we’re connecting one side of the LDR to the GPIO 18 pin, and one side to the 3.3V pin
  • attach the negative side of the capacitor (marked with a -) to the ground pin; and the positive side to the GPIO 18 pin
  • I got hold of some longish jumper wires – gives a bit of flexibility when connecting to the Pi. I cut the ends off and soldered it to the LDR and cap.

electricity-monitor-components

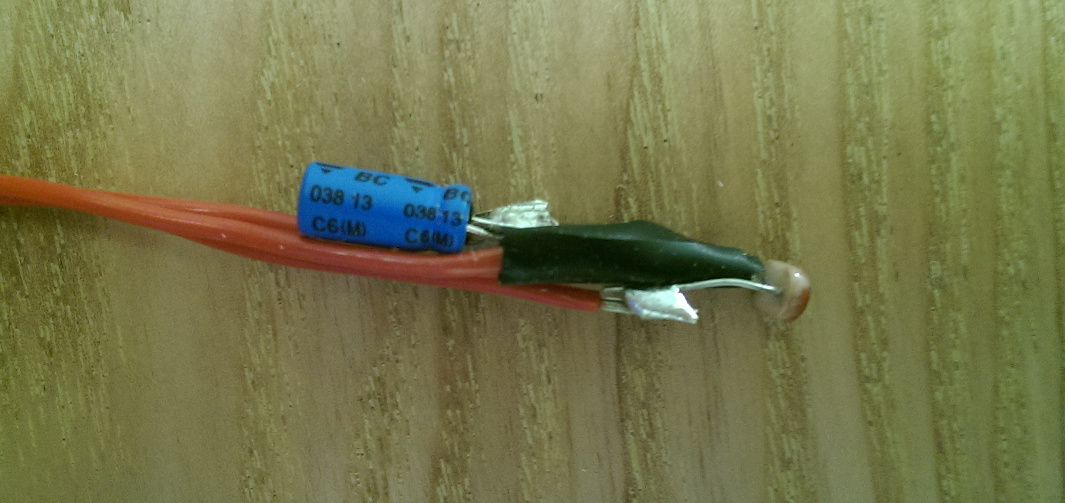
Note the pro touch of adding a little bit of electrical tape around the connection between the LDR and the cap.

Why do we need the capacitor? The Raspberry Pi’s general purpose input/output (GPIO) pins are digital – they can only be either “high” or “low” and this depends on the voltage passing through. (approx 2V is considered “high”) The LDR is analogue; so we need to use a capacitor to quantise the values. This article explains it well.

Hardware done – on to the software.


The Adafruit guide also includes a bit of Python for measuring the resistance; so that can be used as the basis for the software side. The function RCtime does all the work of reading a value off the Pi’s general purpose input/output (GPIO) pin and gives us back a nice integer value.

So we first of all need to determine whether the light is on or off; based on some threshold value – i.e. what resistance from the LDR means the light is on.

threshold = 7000
while True:
     reading = RCtime(18)
     signal = True
     if reading > threshold:
         signal = False

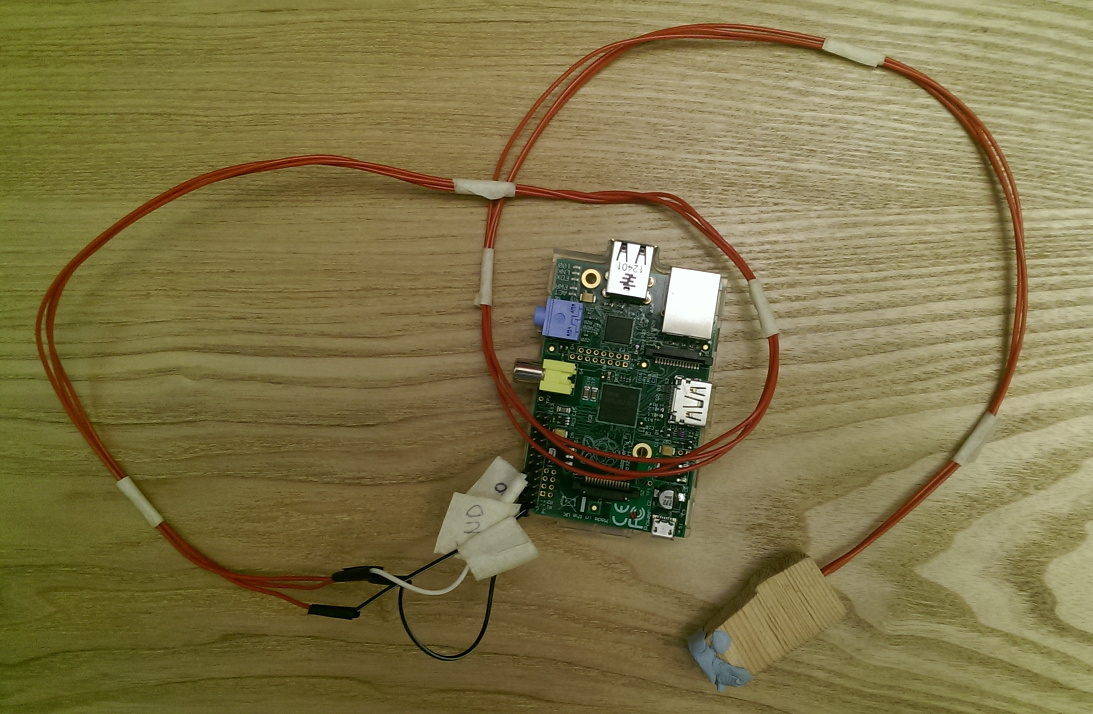
It took me a while to get the right threshold value – I also ended up “masking off” the LDR by putting it inside a bit of wood with a hole drilled through it, and blue tacking it to the meter! Doing this made it much easier to find the threshold.

pi-electricity-monitor-rasppi

Then, if the LED is on, and it was previously off, we can work out how long it was off for, and use that to calculate an instantaneous reading in watts of the power that is being used:

if lastSignal == False and signal == True:
    newTime = time.time()
    difference = newTime - lastTime
    power = seconds_in_an_hour / (difference * meter_constant)
    lastTime = newTime
lastSignal = signal

Finally, we can write it all out to stdout. When we run it, we can always redirect stdout so we can e.g. save the data for later analysis.

python monitor.py > power.csv

Now; it would be great to get this data up to a cloud service like Azure or maybe just plot.ly and have a graph I can obsess over day and night… but i’ll leave that for a later project.

You can find the code on Github.

Keatsbot

Markov chains are kind of like state machines; with a probability attached to each transition. Each state has no memory of previous states. They have plenty of applications but a very common one is generating realistic text – for example, fooling Bayesian spam filters.

I’ve had a long standing desire to make a Twitter bot using Markov chains; perhaps to make up for the lack of my own tweets! The plan is pretty easy, we need to build our model, produce some output; and use the Twitter API to post it.

The theory behind building the model is simple. If we take a sample corpus; for example the first paragraph of this blog post; we can analyse the text to see that if the current letter is a then the probability of the next letter being an r is 0.15; the probability of it being a t is 0.2; the probability of it being an i is 0.1 and so on.

This can then be extended to pairs of letters; or even words. Then; by walking the resulting Markov chain, we can mimic the style of the writer. From this description; it’s easy to see how the size of the corpus is going to change the probabilities and affect the final result.

First things first – we need a reasonably large corpus from which to generate the text – I picked John Keats; hopeless romantic and lover of nightingales; which fits with a theme of tweeting. We can get hold of a few bits of Keat’s work from Project Gutenburg. Some clean up of the text is required to remove unwanted words – the preamble; line numbers and headings – otherwise these will “pollute” our corpus.

As for the code; this being the 21st Century we don’t have to do much of this ourselves. We can quickly Google a bit of Python that’ll generate the Markov chain model and use it to output some text; all courtesy of Shabda Raaj.

A first run leaves a bit to be desired; so we’ll make a few minor adjustments – we make everything lower case; and add a back off to prevent stop words like “and” or “of” appearing at the end of our sentences:

stopwords = ['and', 'of', 'with', 'the', 'a', 'which']
 
# backoff until no stopwords
while gen_words[-1].lower() in stopwords:
    gen_words.pop()

For now, i’ve decided against stripping punctuation from the corpus; and lower casing words before they went into our Markov model. Without doing this; “day.”, “day” and “Day” are all treated as separate words; so our output has a bit less variety – often Keatsbot will lift whole sentences from the underlying corpus. What a fraud. But I think on balance it gets us closer to Keat’s style; since punctuation is of course part of that style.

Finally; we want to tweet it. Ricky Rosario helps us with this, pointing us to the excellent Python Twitter Tools. We just need to pip install twitter to download the package; then it’s as easy as:

twitter = Twitter(auth=OAuth(token, token_key, con_secret_key, con_secret))
twitter.statuses.update(status=output)

So – set up a Twitter account; add an application from the developer console to get the various OAuth keys; and we can sing of summer in full-throated ease!

You can find the full code on Github.

Rasteriser

I’ve always been fascinated by 3D graphics – there’s just a great intersection between art and algebra there – and in an attempt to better understand how it all works i’ve written a couple of software rasterisers in the past. Here’s a surviving effort that also uses CMake, a cross platform build tool.

Originally this used git modules to include a separate library that contained the geometry or algebra code for matrix multiplication/transform etc. I totally missed this when unearthing this 3 year old project and set about rewriting the missing code… if only i’d documented this project at the time!

Of course along with the rasteriser there’s at least one raytracer lying around in the dumping ground that i’m convinced every developer has on their file server… I hope at some point to integrate the raytracer perhaps as an alternative renderer for the same geometry. But we’ll have to see… I guess at the point i’ll end up splitting the library out again.

Procrastination

Yes another tiny project – experimenting with playing audio; which I expected to be much harder than it turned out to be. In fact, you can just embed an audio element and call its play method in Javascript.

This project also makes an attempt at using the accelerometer, using a bit of code from Dan Cox to provide cross browser support.

I actually wrote this under a slightly different name for some former colleagues of mine; and I wanted to email it to them – so another interesting technique I used was to embed the image and audio data directly into the HTML; so I can “ship it” as one file.

Anyway – if I can just stop procrastinating maybe I can finish off a few more important jobs…

Isometric

I’ve added a new little project – Isometric. It’s breaking the rules a little bit because it’s not a fully completed project; but I think better to publish than not. I guess eventually it could be a whack-a-mole type game.

It’s not driven in the most efficient way – I’ve written a little geometry library and use matrices to transform and scale coordinates to match what I need to draw out my little isometric tiles. But it’s a fun way to do it and gives me an easy way to reverse a screen-coordinate mouse click to get a world-coordinate tile; which is otherwise quite challenging with an isometric viewpoint.

The code is, as usual; disgusting at the moment, including some commented out stuff for rendering world tiles like grass and sea; and some “inline tests” which check the code is giving the expected result and pops up alert boxes when it fails! Shocking!

I’ll investigate a JS unit testing framework and integrate it into my workflow next time; it’d be a massive help for this kind of trivially testable stuff.

Continent Map – Iterate!

How wrong could I be?

The simplest way to do this is get hold of a bitmap with the regions we want coloured in with just one plain colour. When you click the screen; check the value at that point in the bitmap; and use that value as a key into your list of countries.

Uhh, no; maybe in the 90s. Nowadays in a modern browser; the easiest way is to use an SVG image, with the D3 library. Then we can use jquery style CSS selectors to add click handlers to relevant paths; and on a click event modify its attributes to change the fill colour. D3 also gives us panning and zooming functionality.

Anyway i’ve updated my little project – it’s no longer canvas; I just use an SVG image and the render loop has gone.

There is a small problem – it doesn’t work on my iPad. Debugging will have to wait for another day i’m afraid; perhaps after i’ve added a few more fun bits to it.

Continent Map

Edit: This project has been updated. To view the code referred to here; you’ll need to look at an earlier revision.


I love Warlight. It’s a dangerous obsession for me. The game is basically multiplayer Risk, with a lot of different possible maps; and a few other additions as well. Risk is super simple though. Surely we can write a Risk game in HTML5 Canvas?

Let’s have a quick sketch of the bare minimum features for a complete game:

  1. Click detection – for selecting countries.
  2. Flood filling or highlighting the selected country in some way.
  3. Maintaining a list of connected countries.
  4. Some kind of state machine to manage the order building and turn-taking.
  5. An AI to act as the other player.

Well, suddenly it seems pretty daunting. And I am definitely distracted by flood filling. For some reason, i’d love to have a go at flood filling. I’d like to fill it slowly, so you can watch it happen. I can’t stop thinking about Warlight, and flood filling. So now i’ve got two obsessions.

To motivate myself through this project, while maintaining two obsessions; I need to break it down a bit. A good starting goal is an app that allows you to click on a map and tell you some bit of information relating to where you clicked. Talk about a bite-sized chunk; it’s totally trivial. It also solves item #1 on our list above.

The simplest way to do this is get hold of a bitmap with the regions we want coloured in with just one plain colour.(1) When you click the screen; check the value at that point in the bitmap; and use that value as a key into your list of countries. This doesn’t have to be the bitmap we render to the screen – we could use a totally different image; perhaps with more colours or textures. To keep it simple though, let’s use the same image. We’ll make a note of this as a “want” for later though.

So what image? We need some assets for this – I mean that’s another whole obsession isn’t it. We could spend ages trying to find the perfect map. Or, just use a coloured continent map from Wikipedia. Boring, not very attractive, but does the job. A bit like my car. It does immediately bring up a problem though; what do we do if the image doesn’t fit in the viewport?

Let’s do nothing for now – after all, i’m a shipper, not a perfectionist – and just make a note of that in our list of “wants”; which is now complete:

  1. Different maps for click detection, and rendering.
  2. Right click drag to move visible part of the map.

Other than that; job’s a good’un. The usual caveat with regards to code quality applies of course. It’s the first iteration! We’ll refactor later… There are another couple of interesting points which come out of this prototype:

  • We’re using a traditional render loop, although as Risk is such a state oriented game it might not be strictly neccessary. I think in the future perhaps we’ll want some animations, in which case it could come in useful.
  • The game “chrome” for the title and status on the bottom, are both built in the DOM, rather than rendered on Canvas. It’s great to be able to use the DOM rather than another UI framework, but whether this is the “right” choice or not… it depends.

[1] Another way to do this would be to use some geographic data (for example GADM data sources) to both render the map and do the hit detection… A fun project all in itself.

Publish and be damned

Like many people, i’d really like to start publishing more of my side projects. Little games are a great way to get started; especially with Canvas – they’re easy to write and publish; and it’s simple to limit the scope – just make a simpler game!

So here are my Little Canvas Projects. They’re just for fun so the code quality is pretty low – the point is to get something “finished” and out there.